notebook: segmenting nuclei with the cellpose napari plugin
Contents
notebook: segmenting nuclei with the cellpose napari plugin#
Overview#
Plugins extend the functionality of napari and can be combined together to build workflows. Many plugins exist for common analysis tasks such as segmentation and filtering. In this activity, we will segment nuclei using the cellpose napari plugin. Please visit the napari hub for a listing of the available plugins.
Data source#
The data were downloaded from the OpticalPooledScreens github repository.
Loading the data#
We will start by loading an image of DAPI stained nuclei. We can use scikit-image’s imread() function to download the data from the link below and load it into a numpy array called nuclei.
from skimage import io

url = 'https://raw.githubusercontent.com/kevinyamauchi/napari-spot-detection-tutorial/main/data/nuclei_cropped.tif'
nuclei = io.imread(url)
Viewing the image#
As we did in the previous notebooks, we can view the image in napari using the napari.view_image() function. Here we set the colormap to magma.
import napari

viewer = napari.view_image(nuclei, colormap='magma')
from napari.utils import nbscreenshot

nbscreenshot(viewer)

Segment nuclei#
To segment the nuclei, we will use the cellpose napari plugin. Please perform the segmentation using the instructions below. For more information on cellpose, please see the paper and repository.
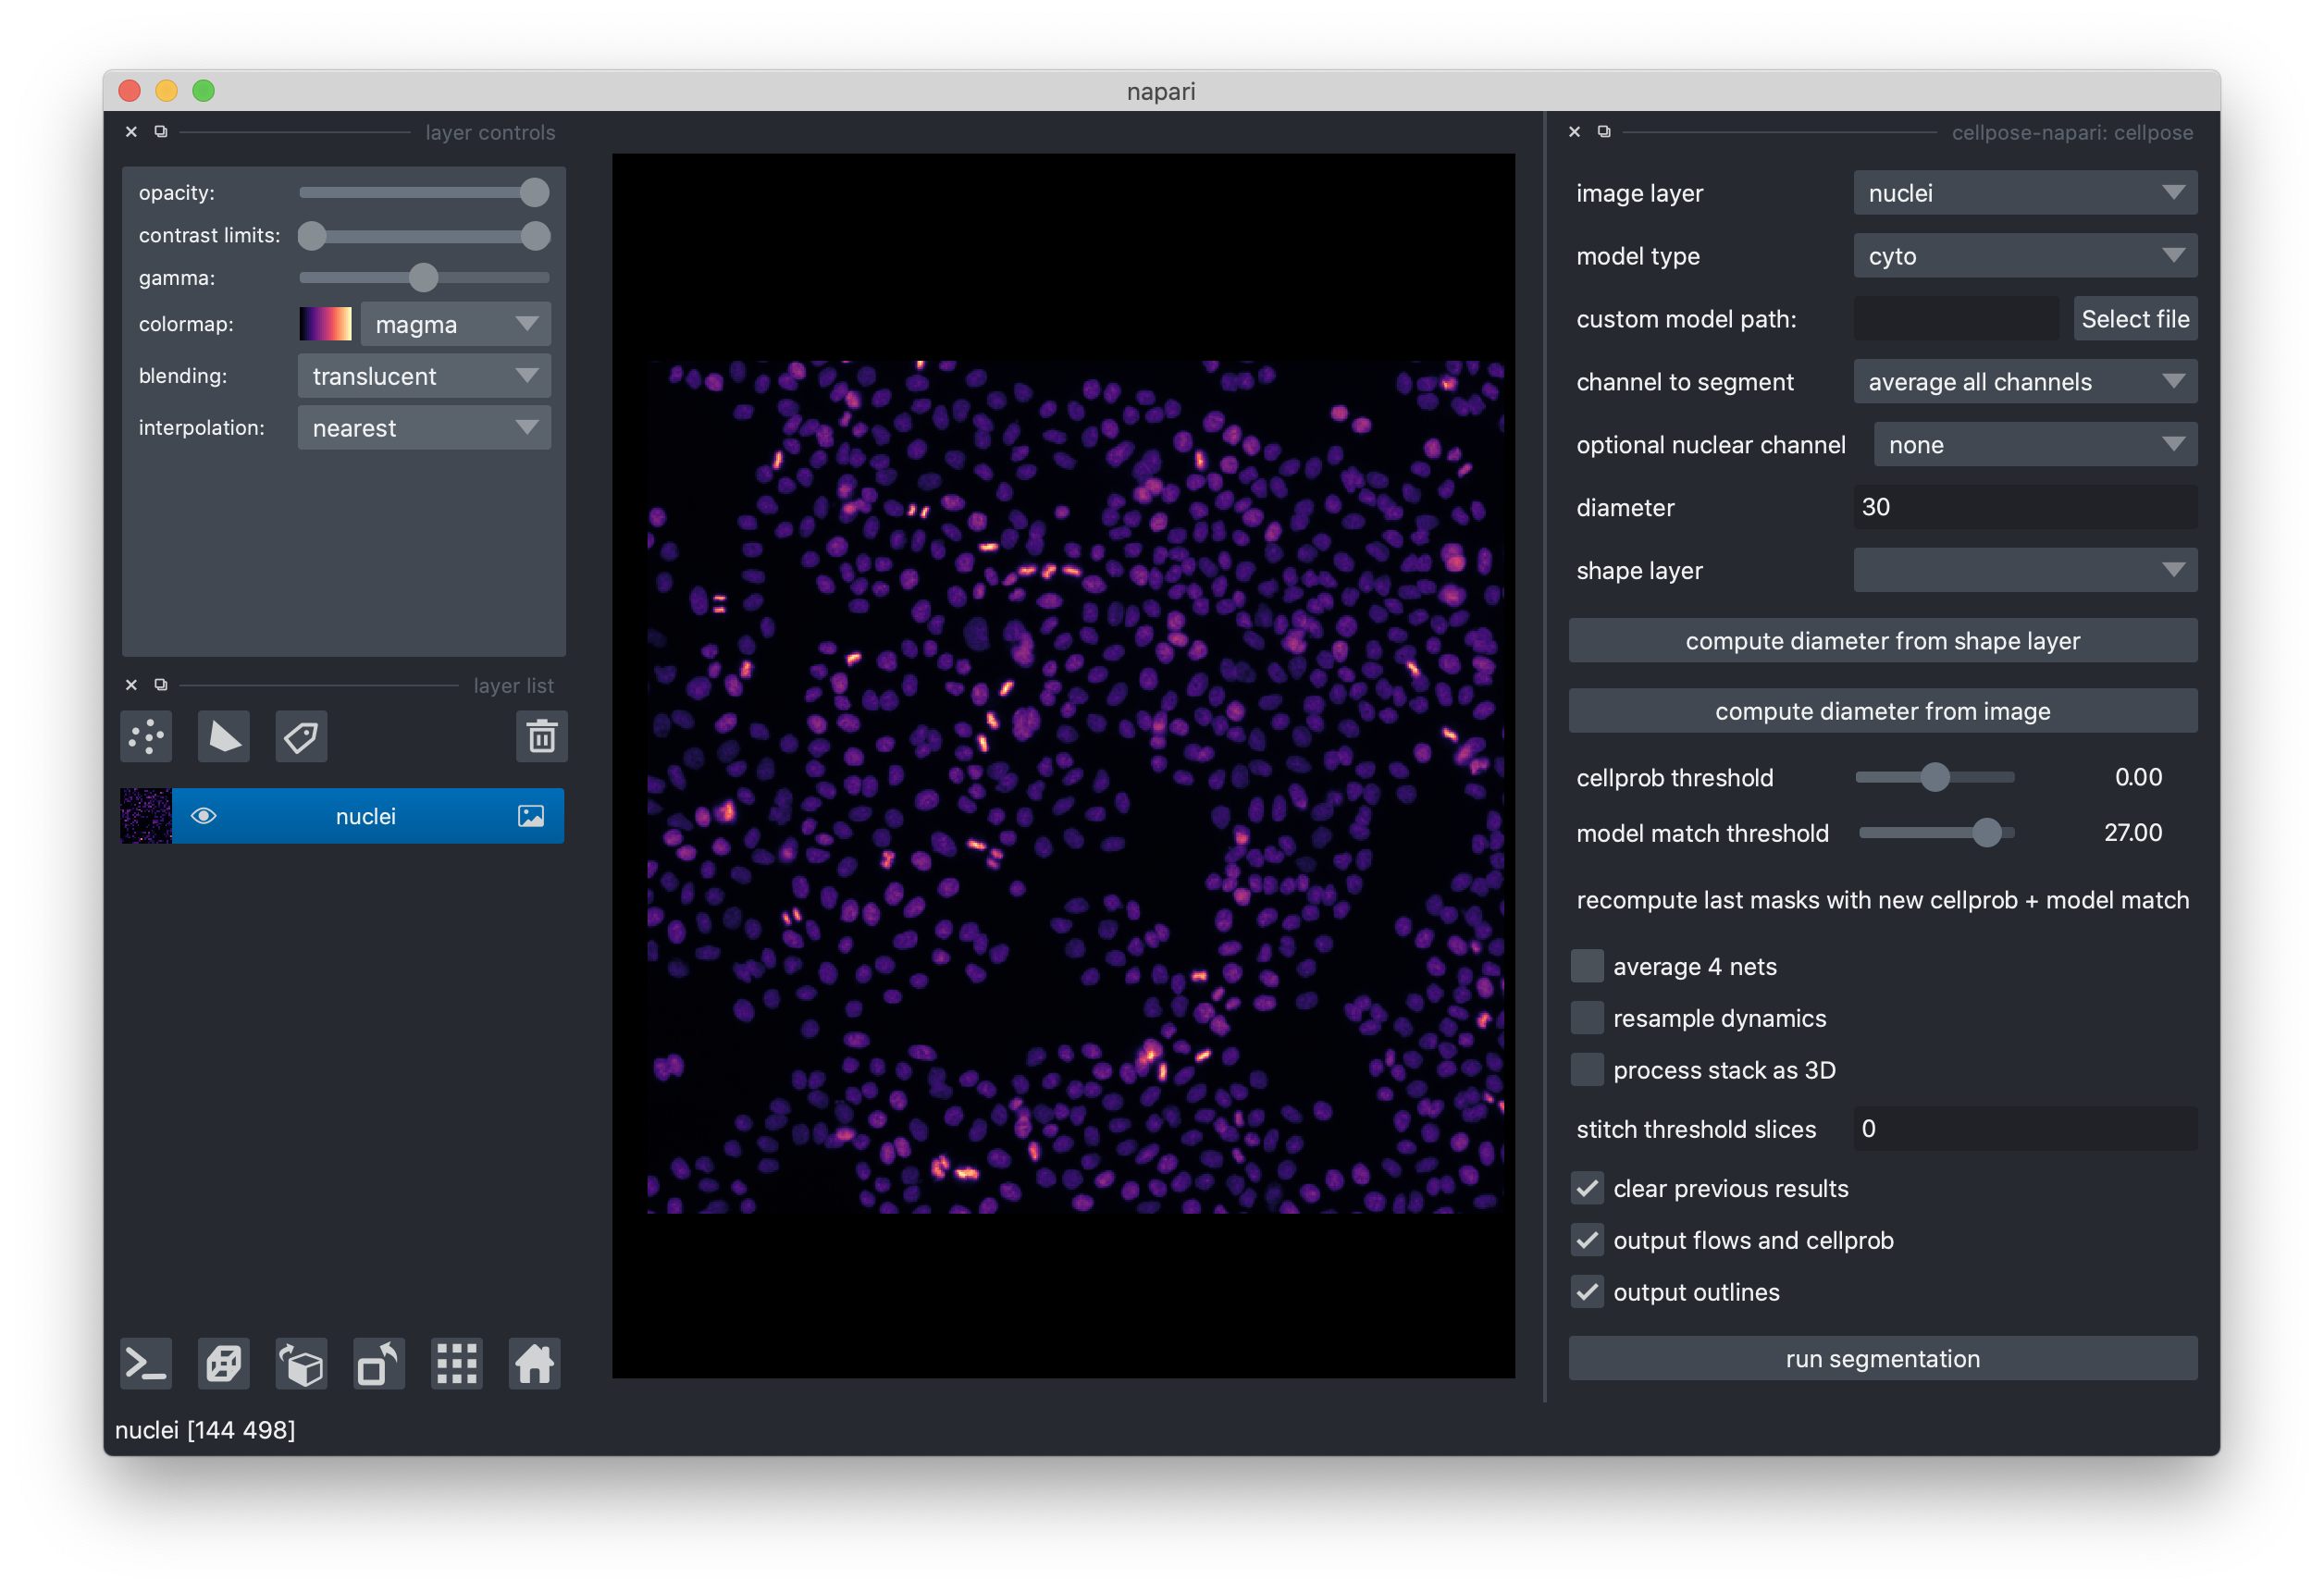
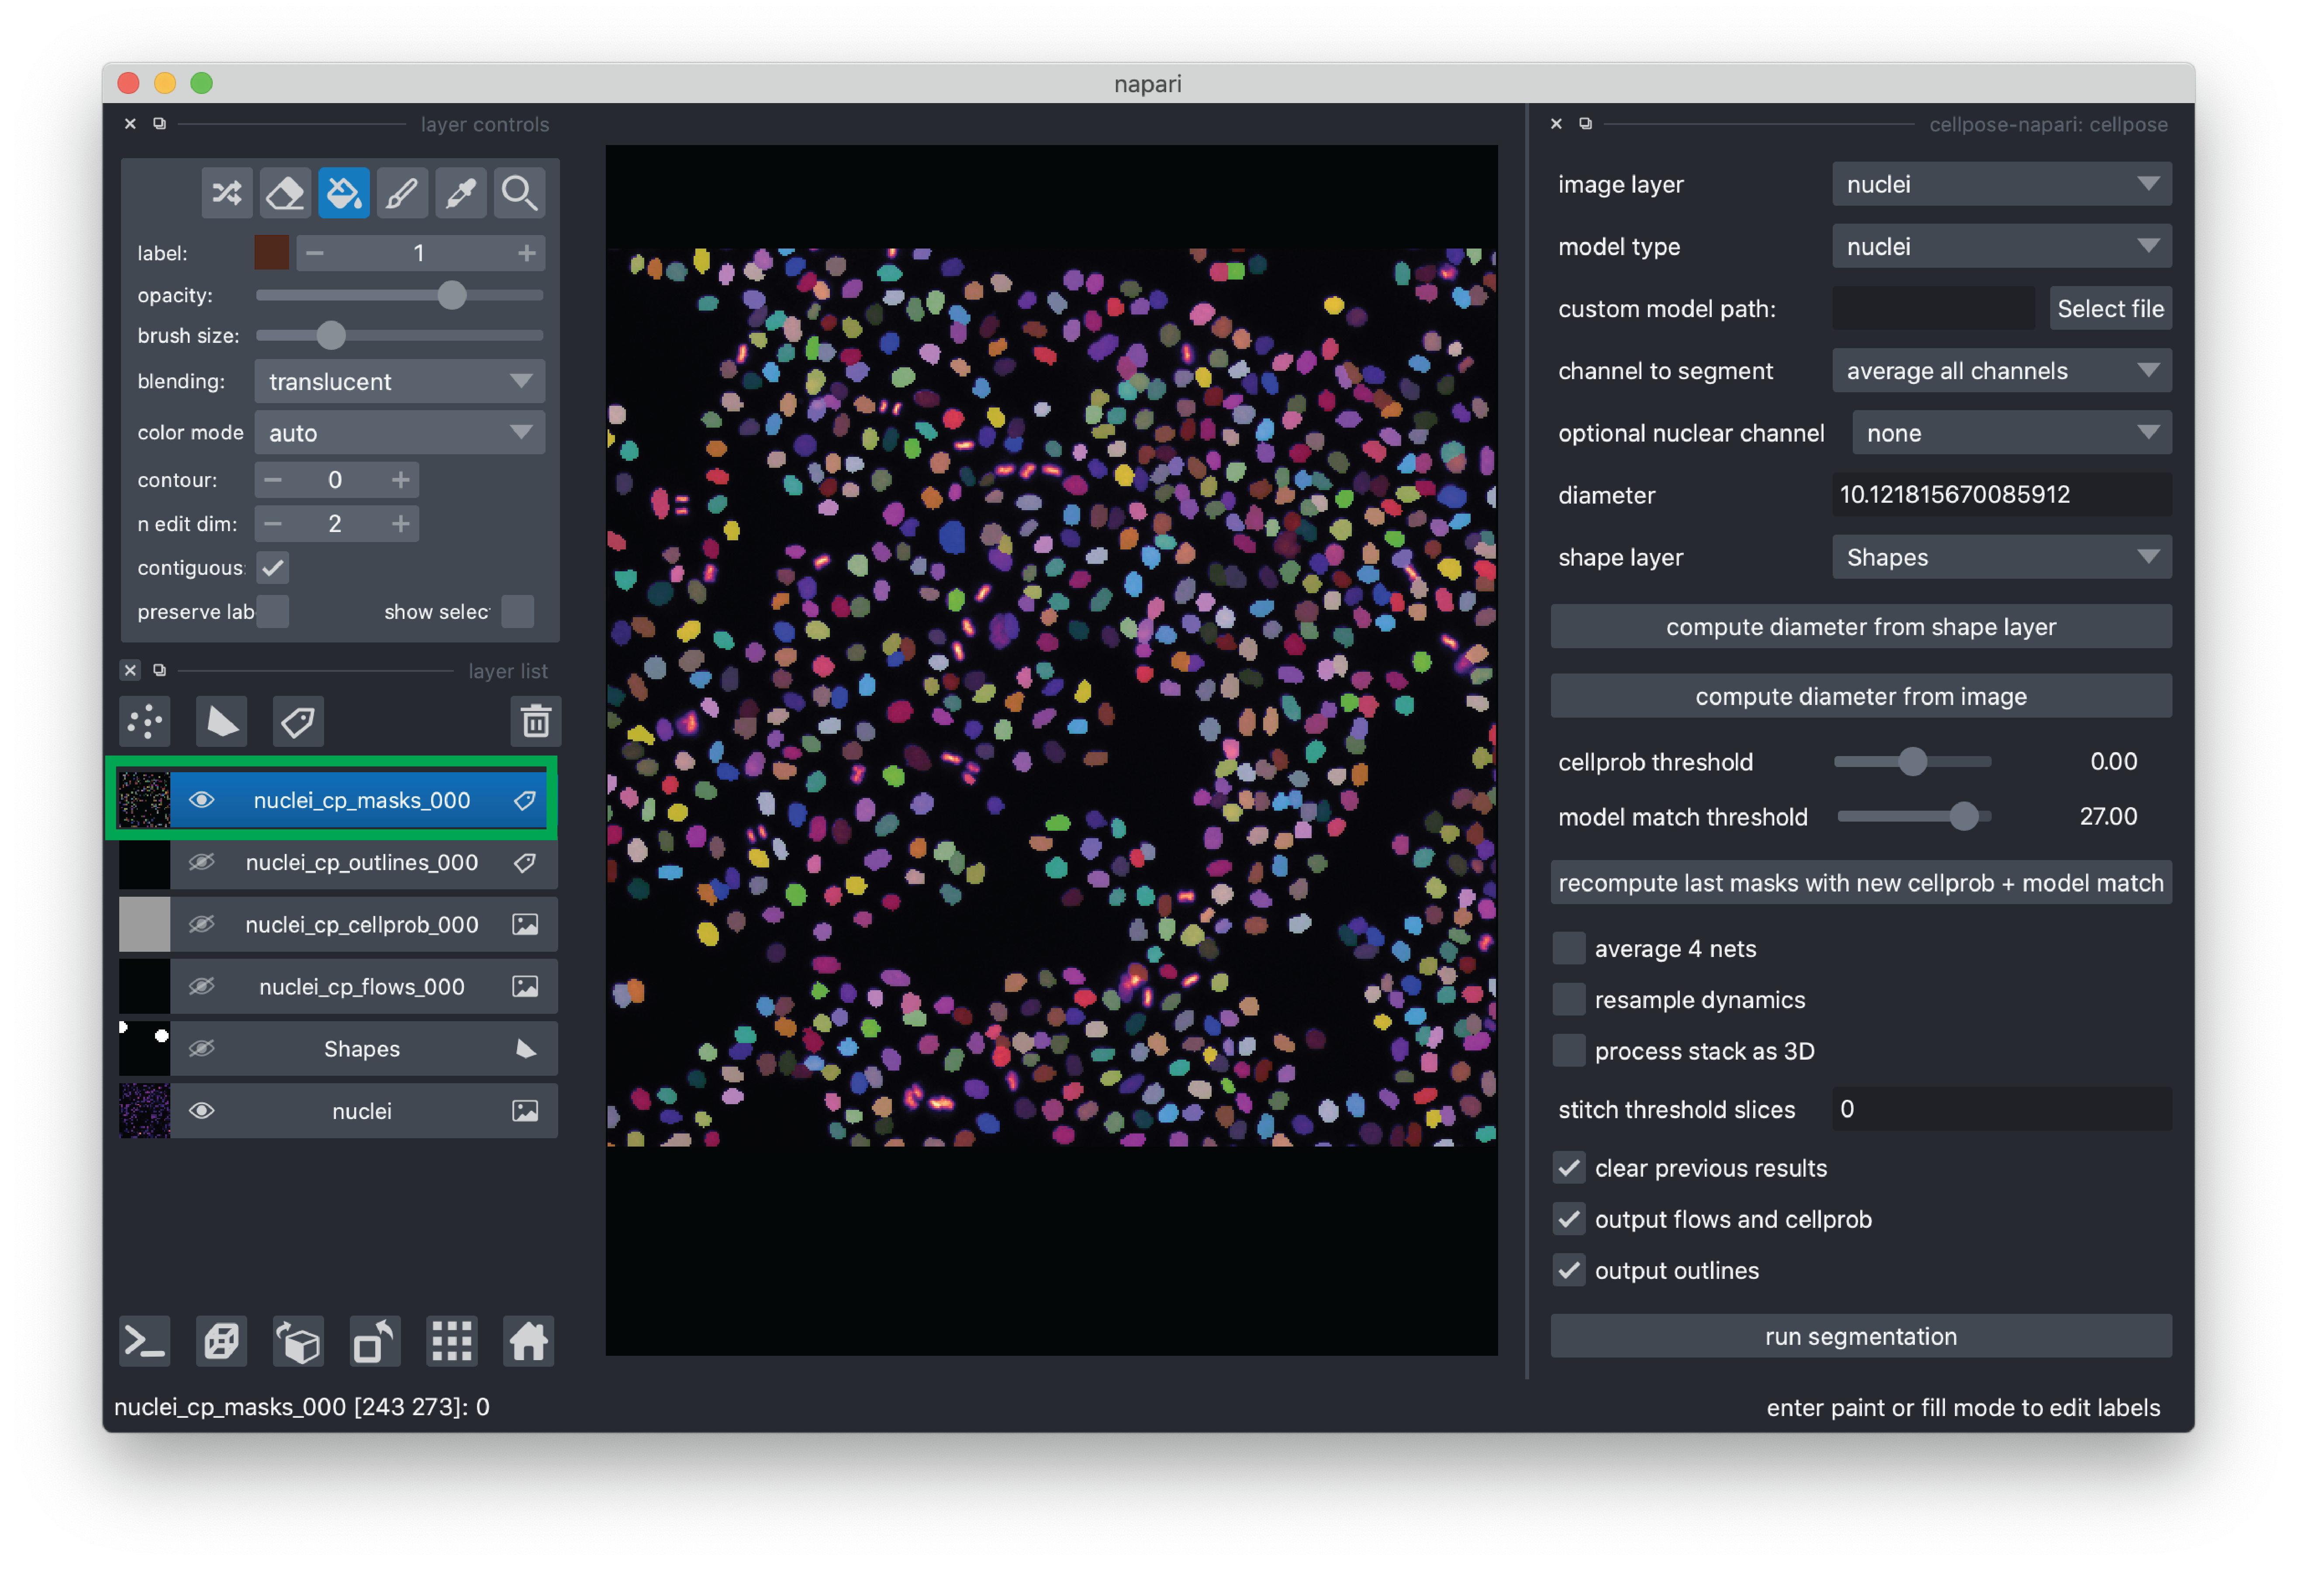
Start the cellpose plugin. From the menu bar, click Plugins->cellpose-napari: cellpose. You should see the plugin added to the right side of the viewer.
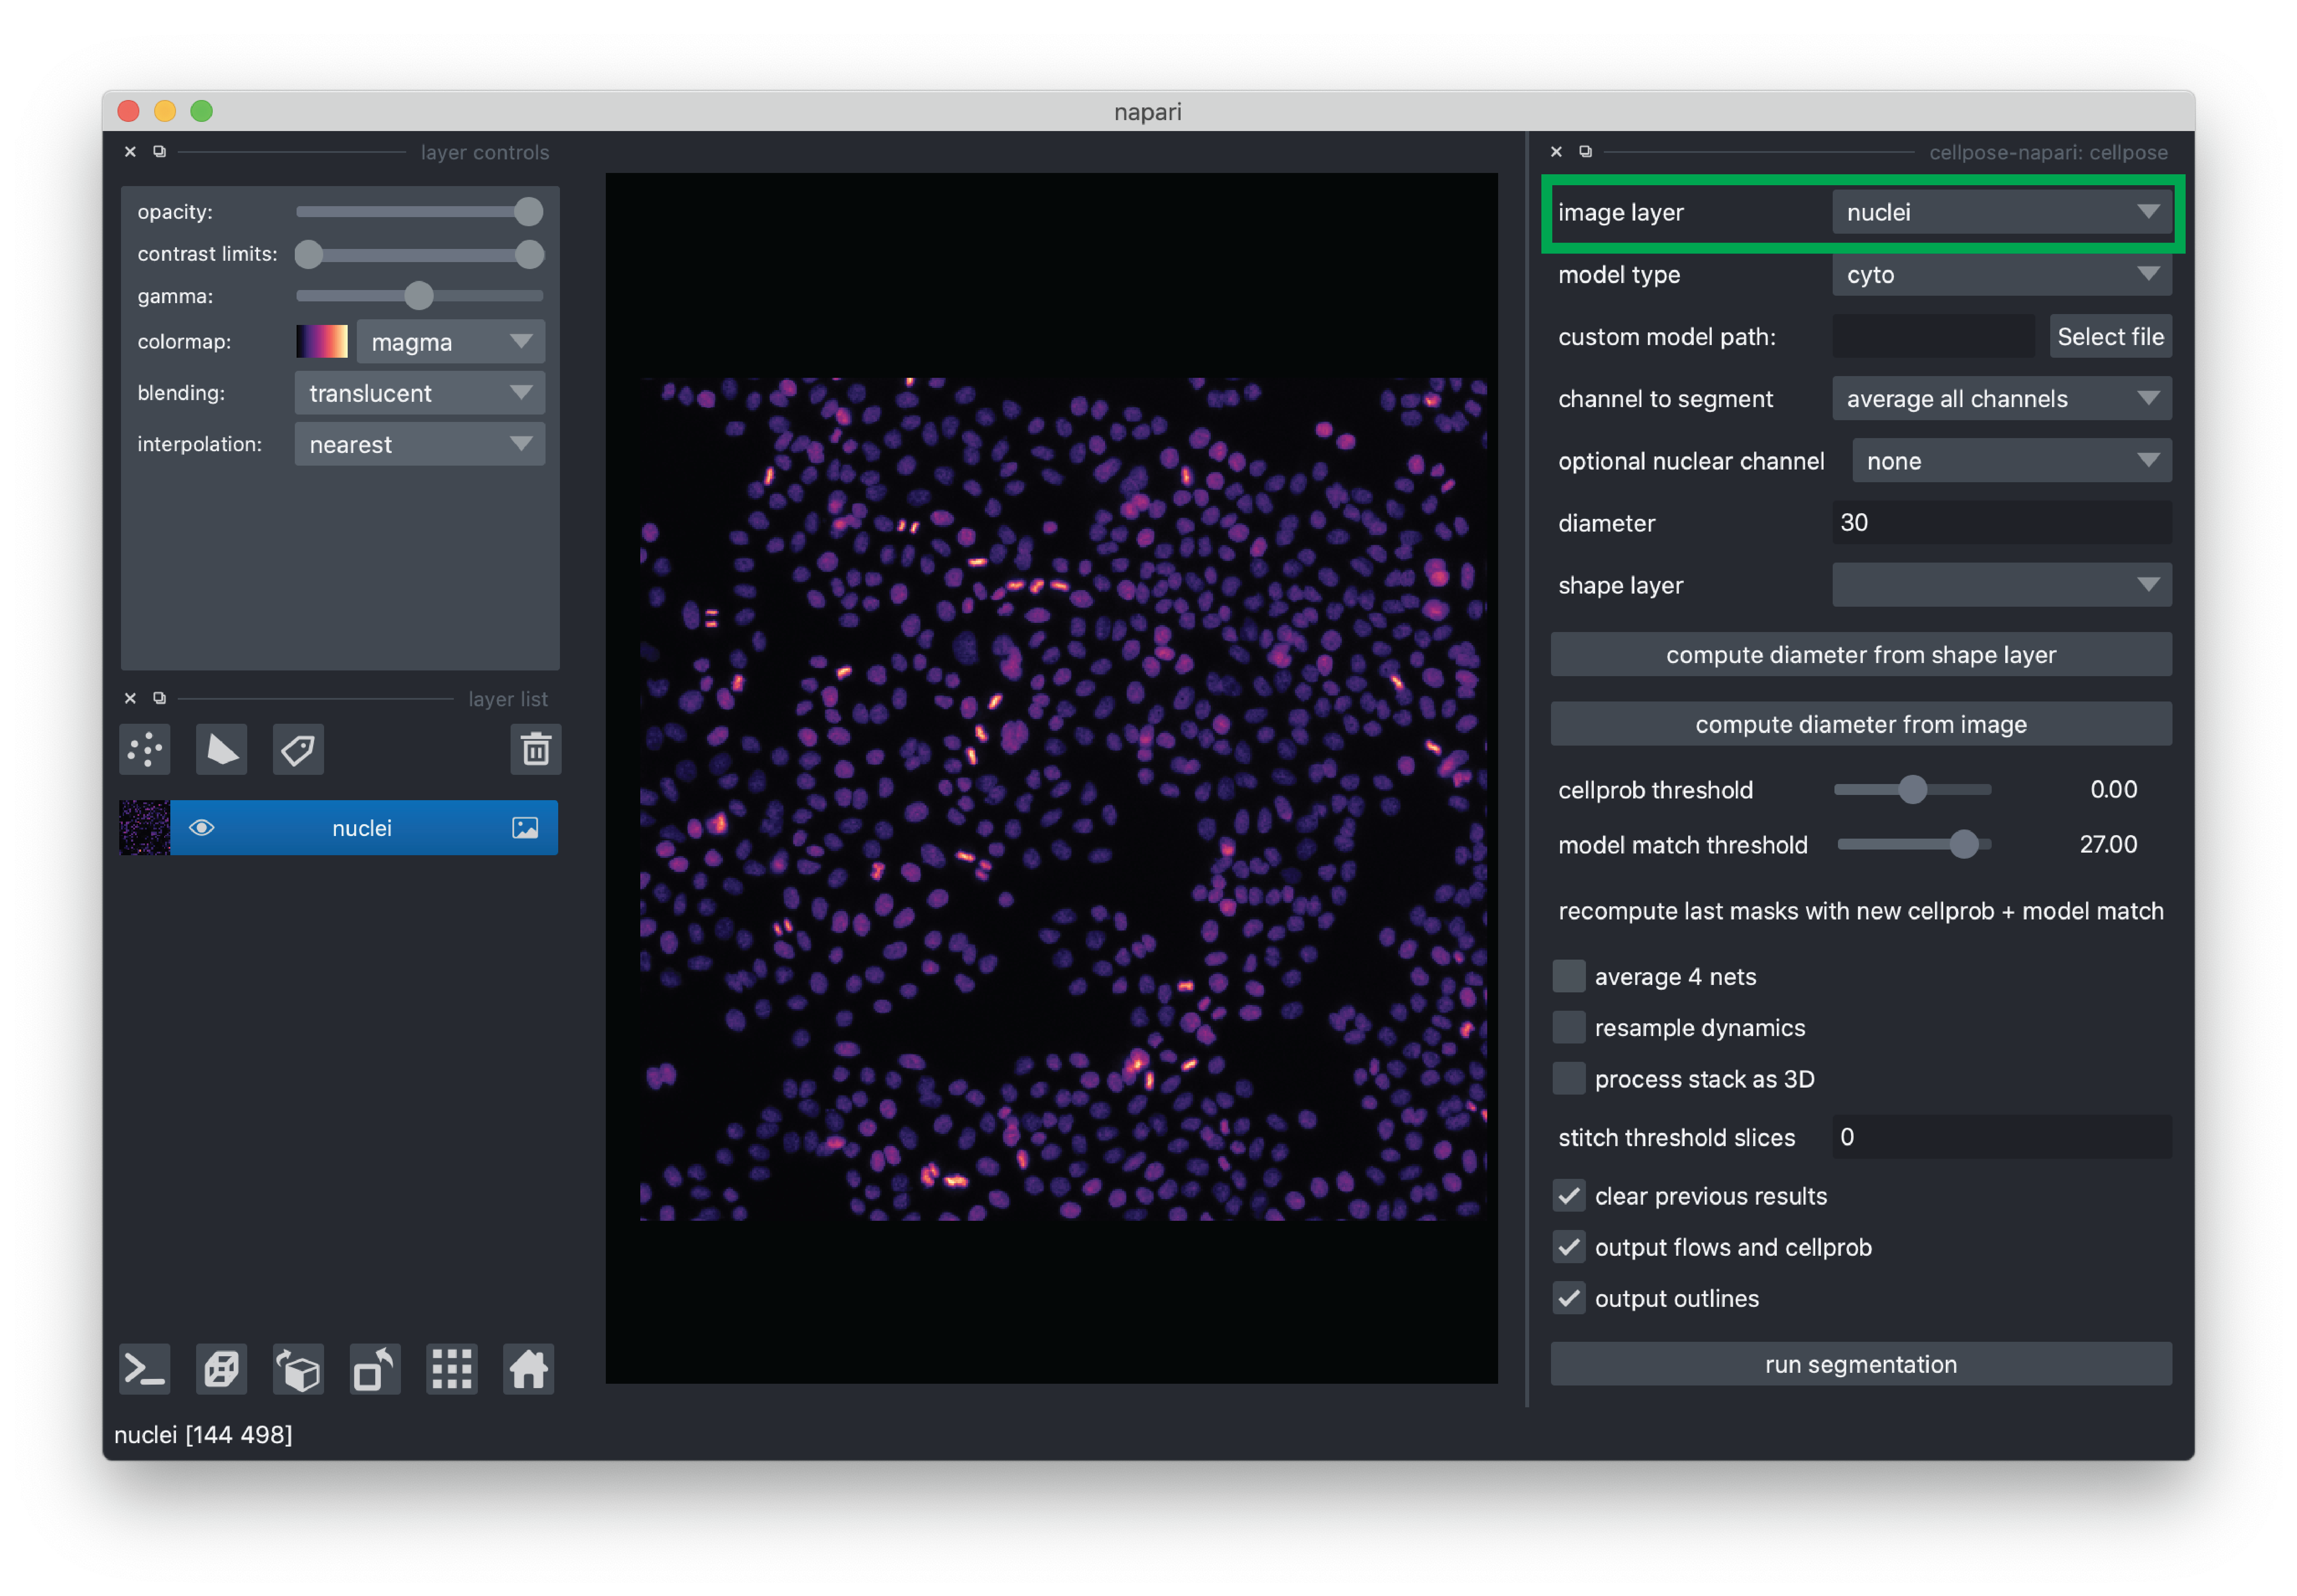
Select the “nuclei” image layer.
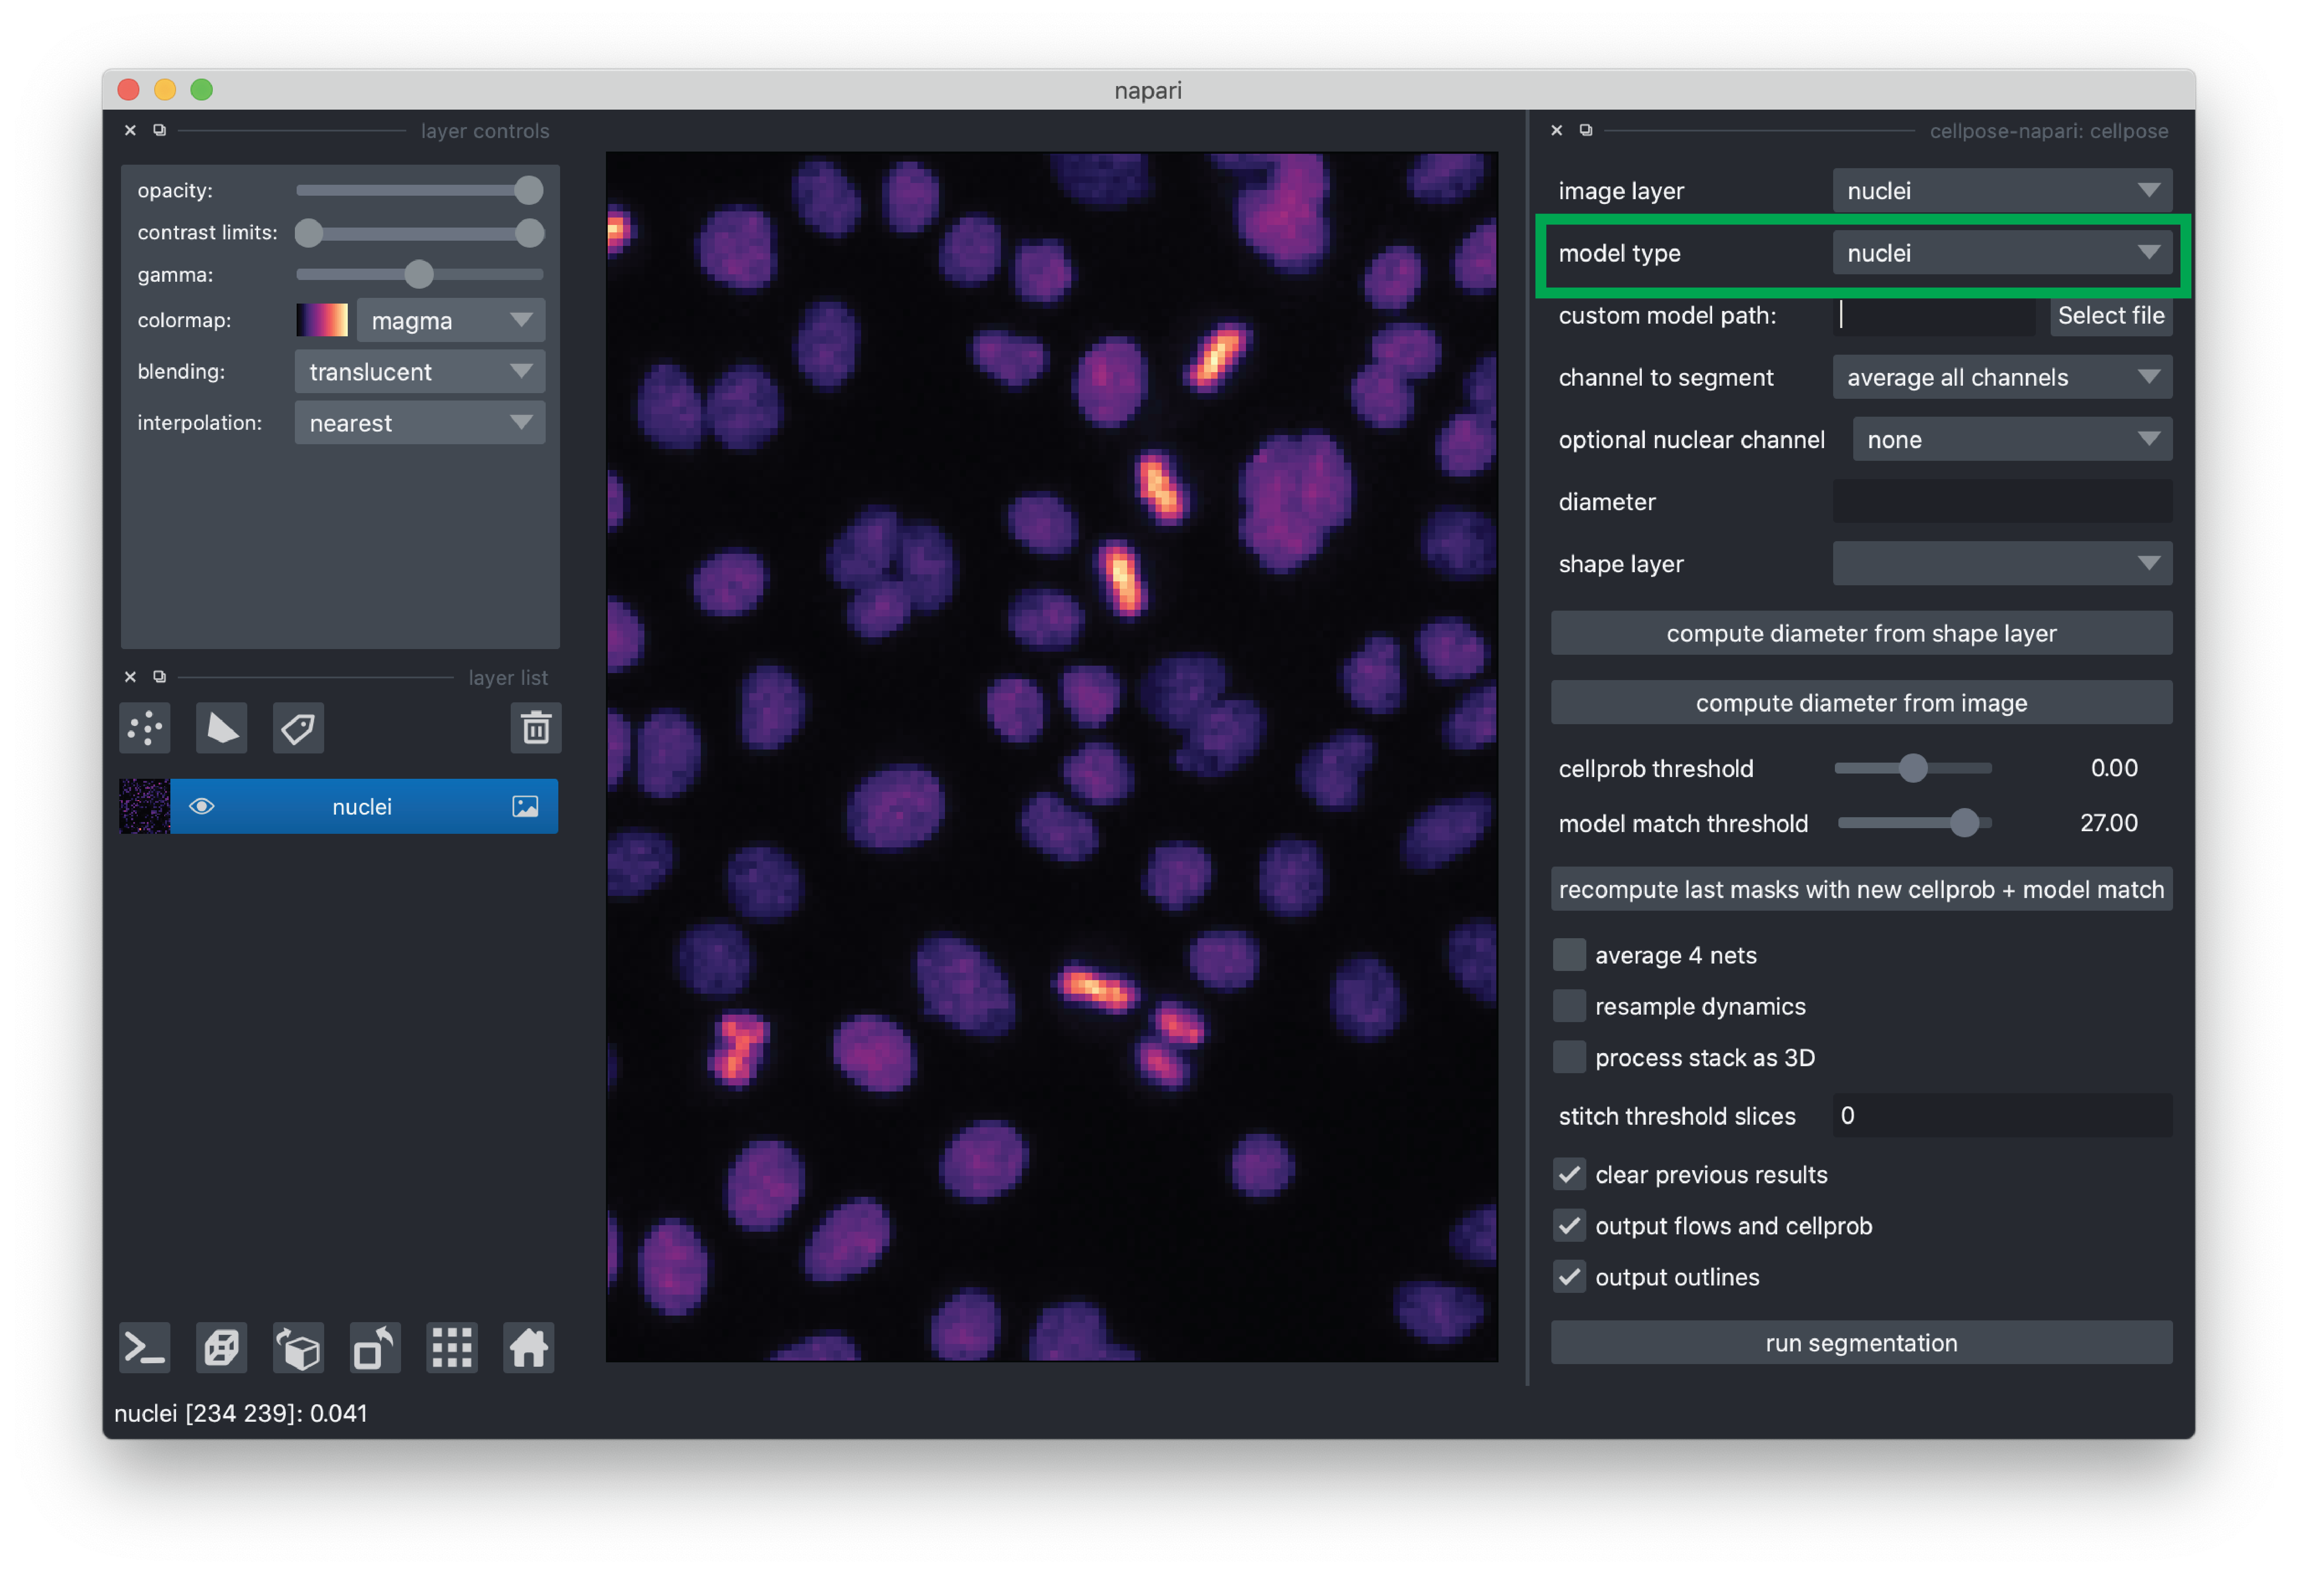
Set the model type to “nuclei”
We need to give cellpose an estimate of the size of the nuclei so it can properly scale the data. We can do so using a napari Shapes layer. With the Shapes layer, we will outline some nuclei and then cellpose will use those annotations to estimate the size of the nuclei.
Click the “add Shapes” layer button in the viewer. This will create and select a new layer called “Shapes”.
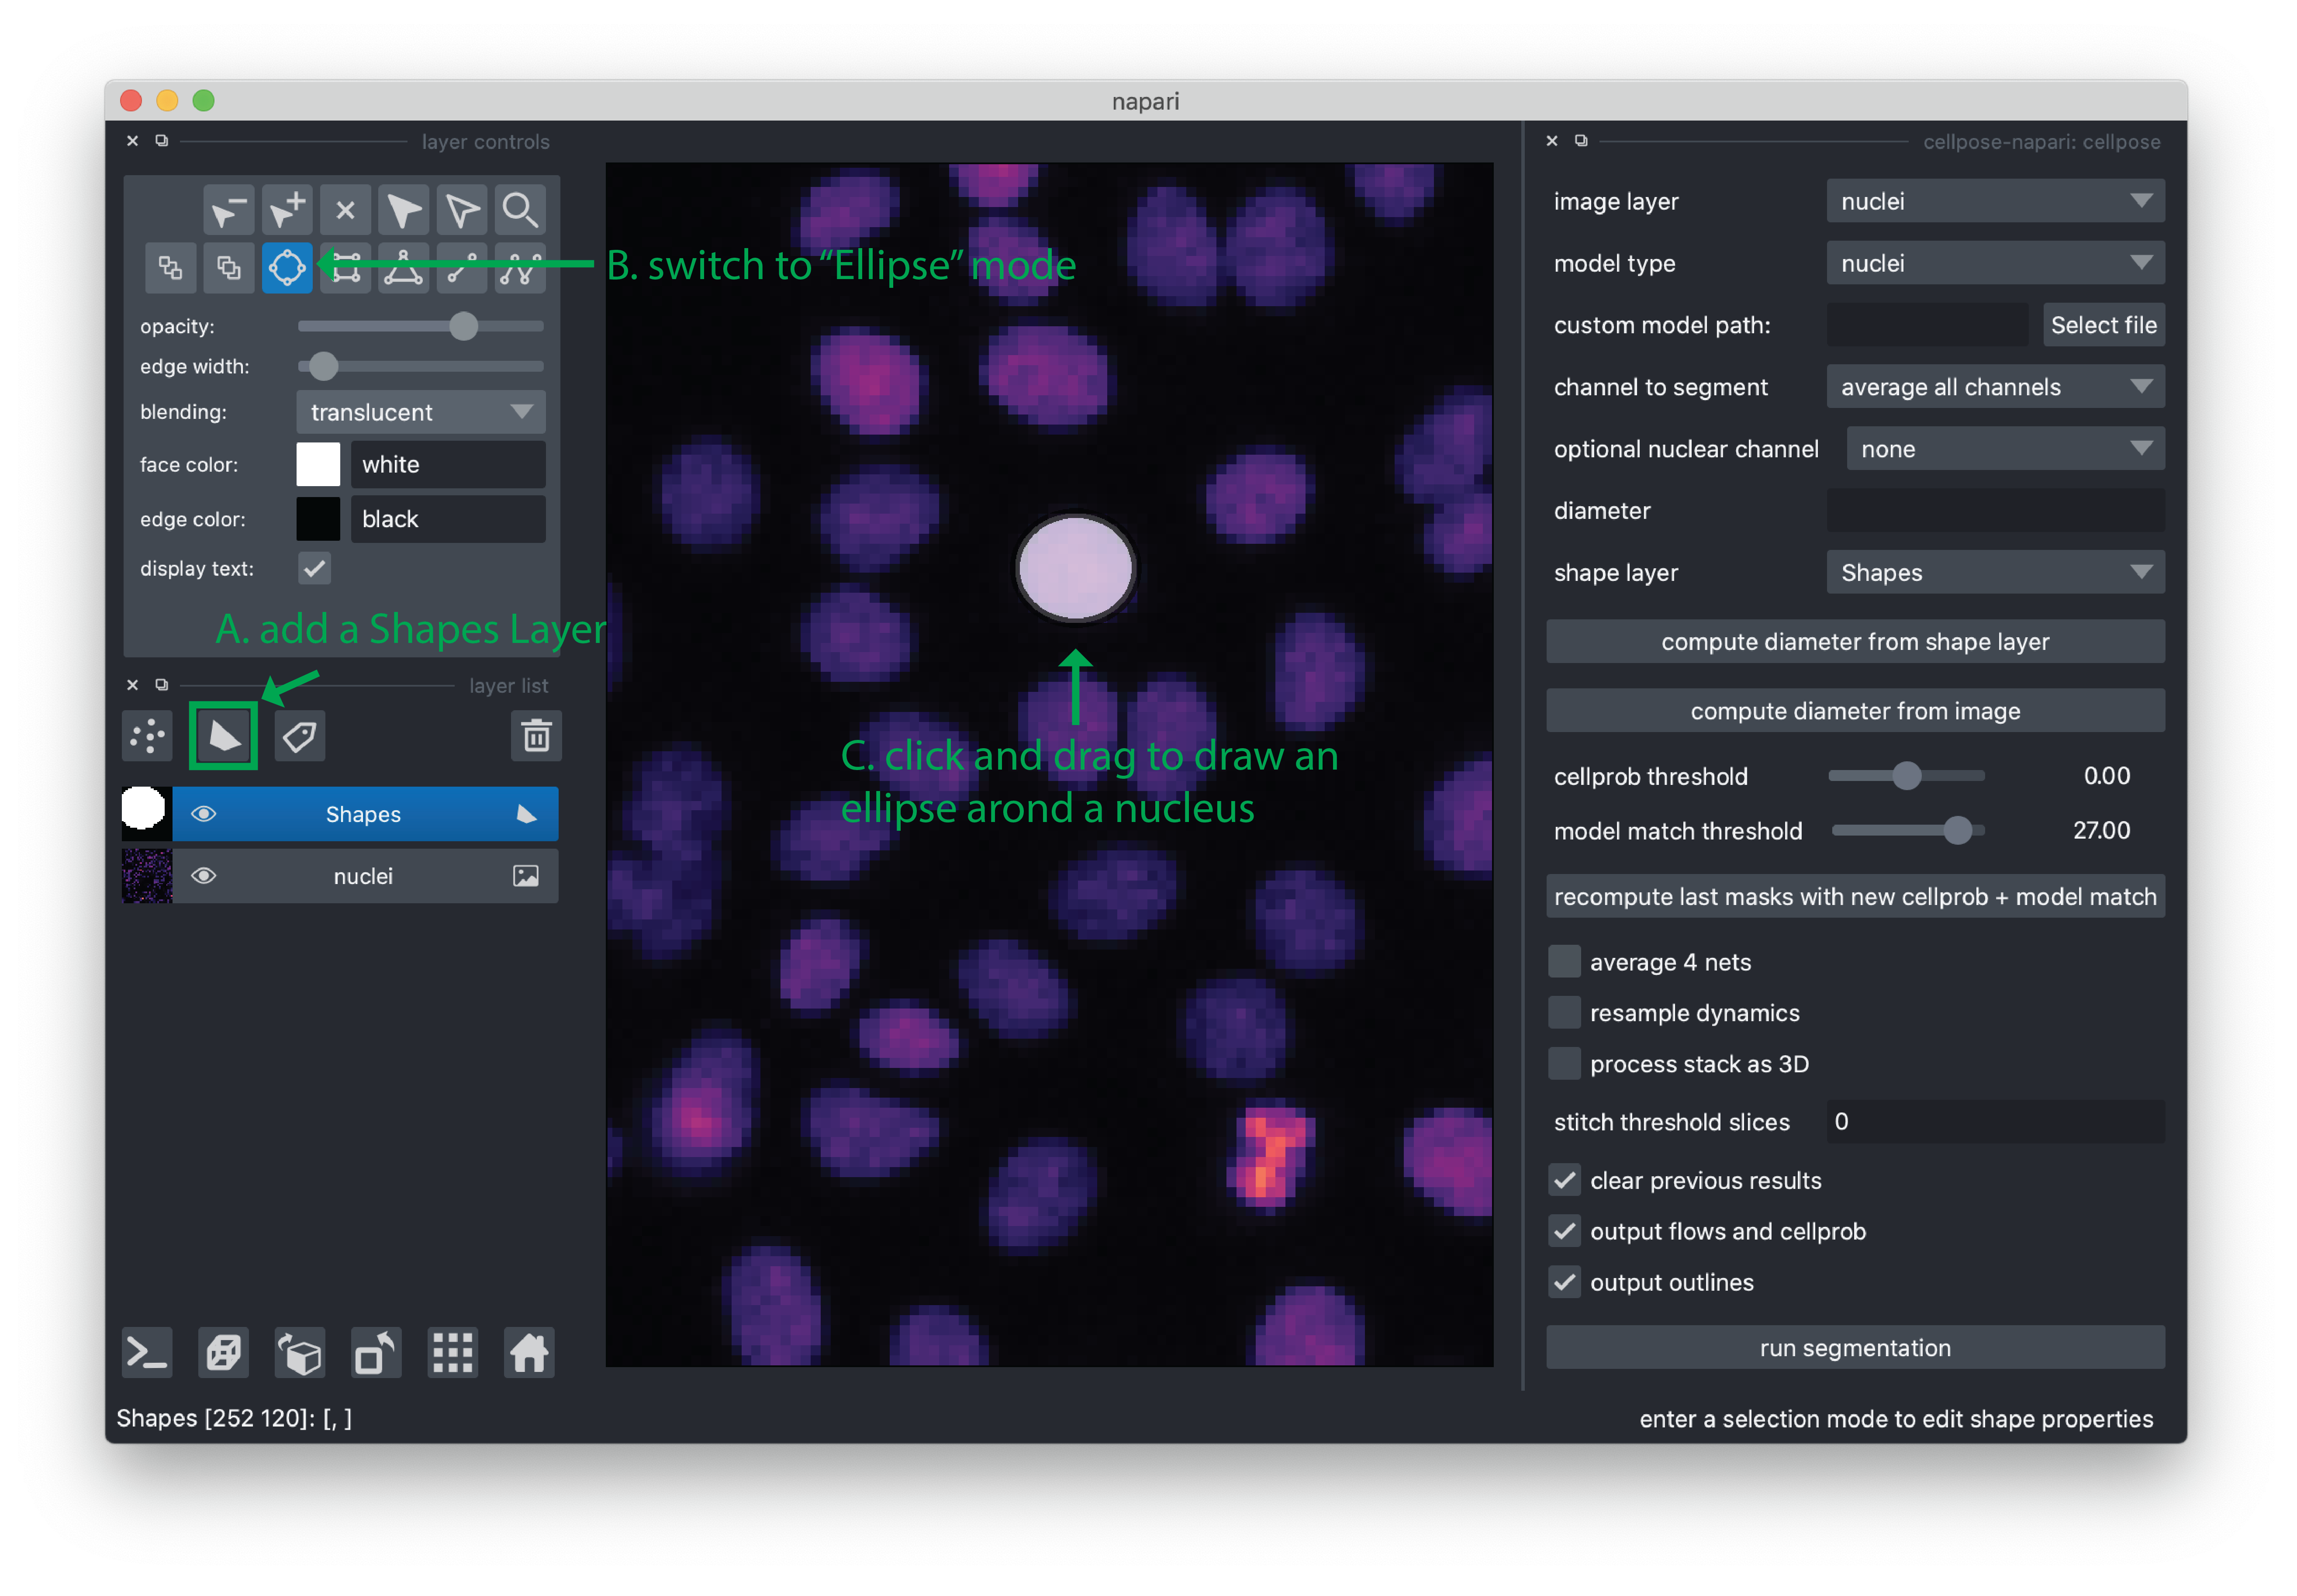
Set the mode to “Ellipse” by clicking the button in the layer controls.
In the canvas, click and drag to add an ellipse that around a “representative” nucleus. For the purpose of this demo, this is enough, but for other data you may need to give more examples to make a better estimate of the cell diameter. If you need to pan/zoom while adding an ellipse, holding the spacebar will allow you to pan/zoom using your mouse (pan via click/drag, zoom by scrolling).
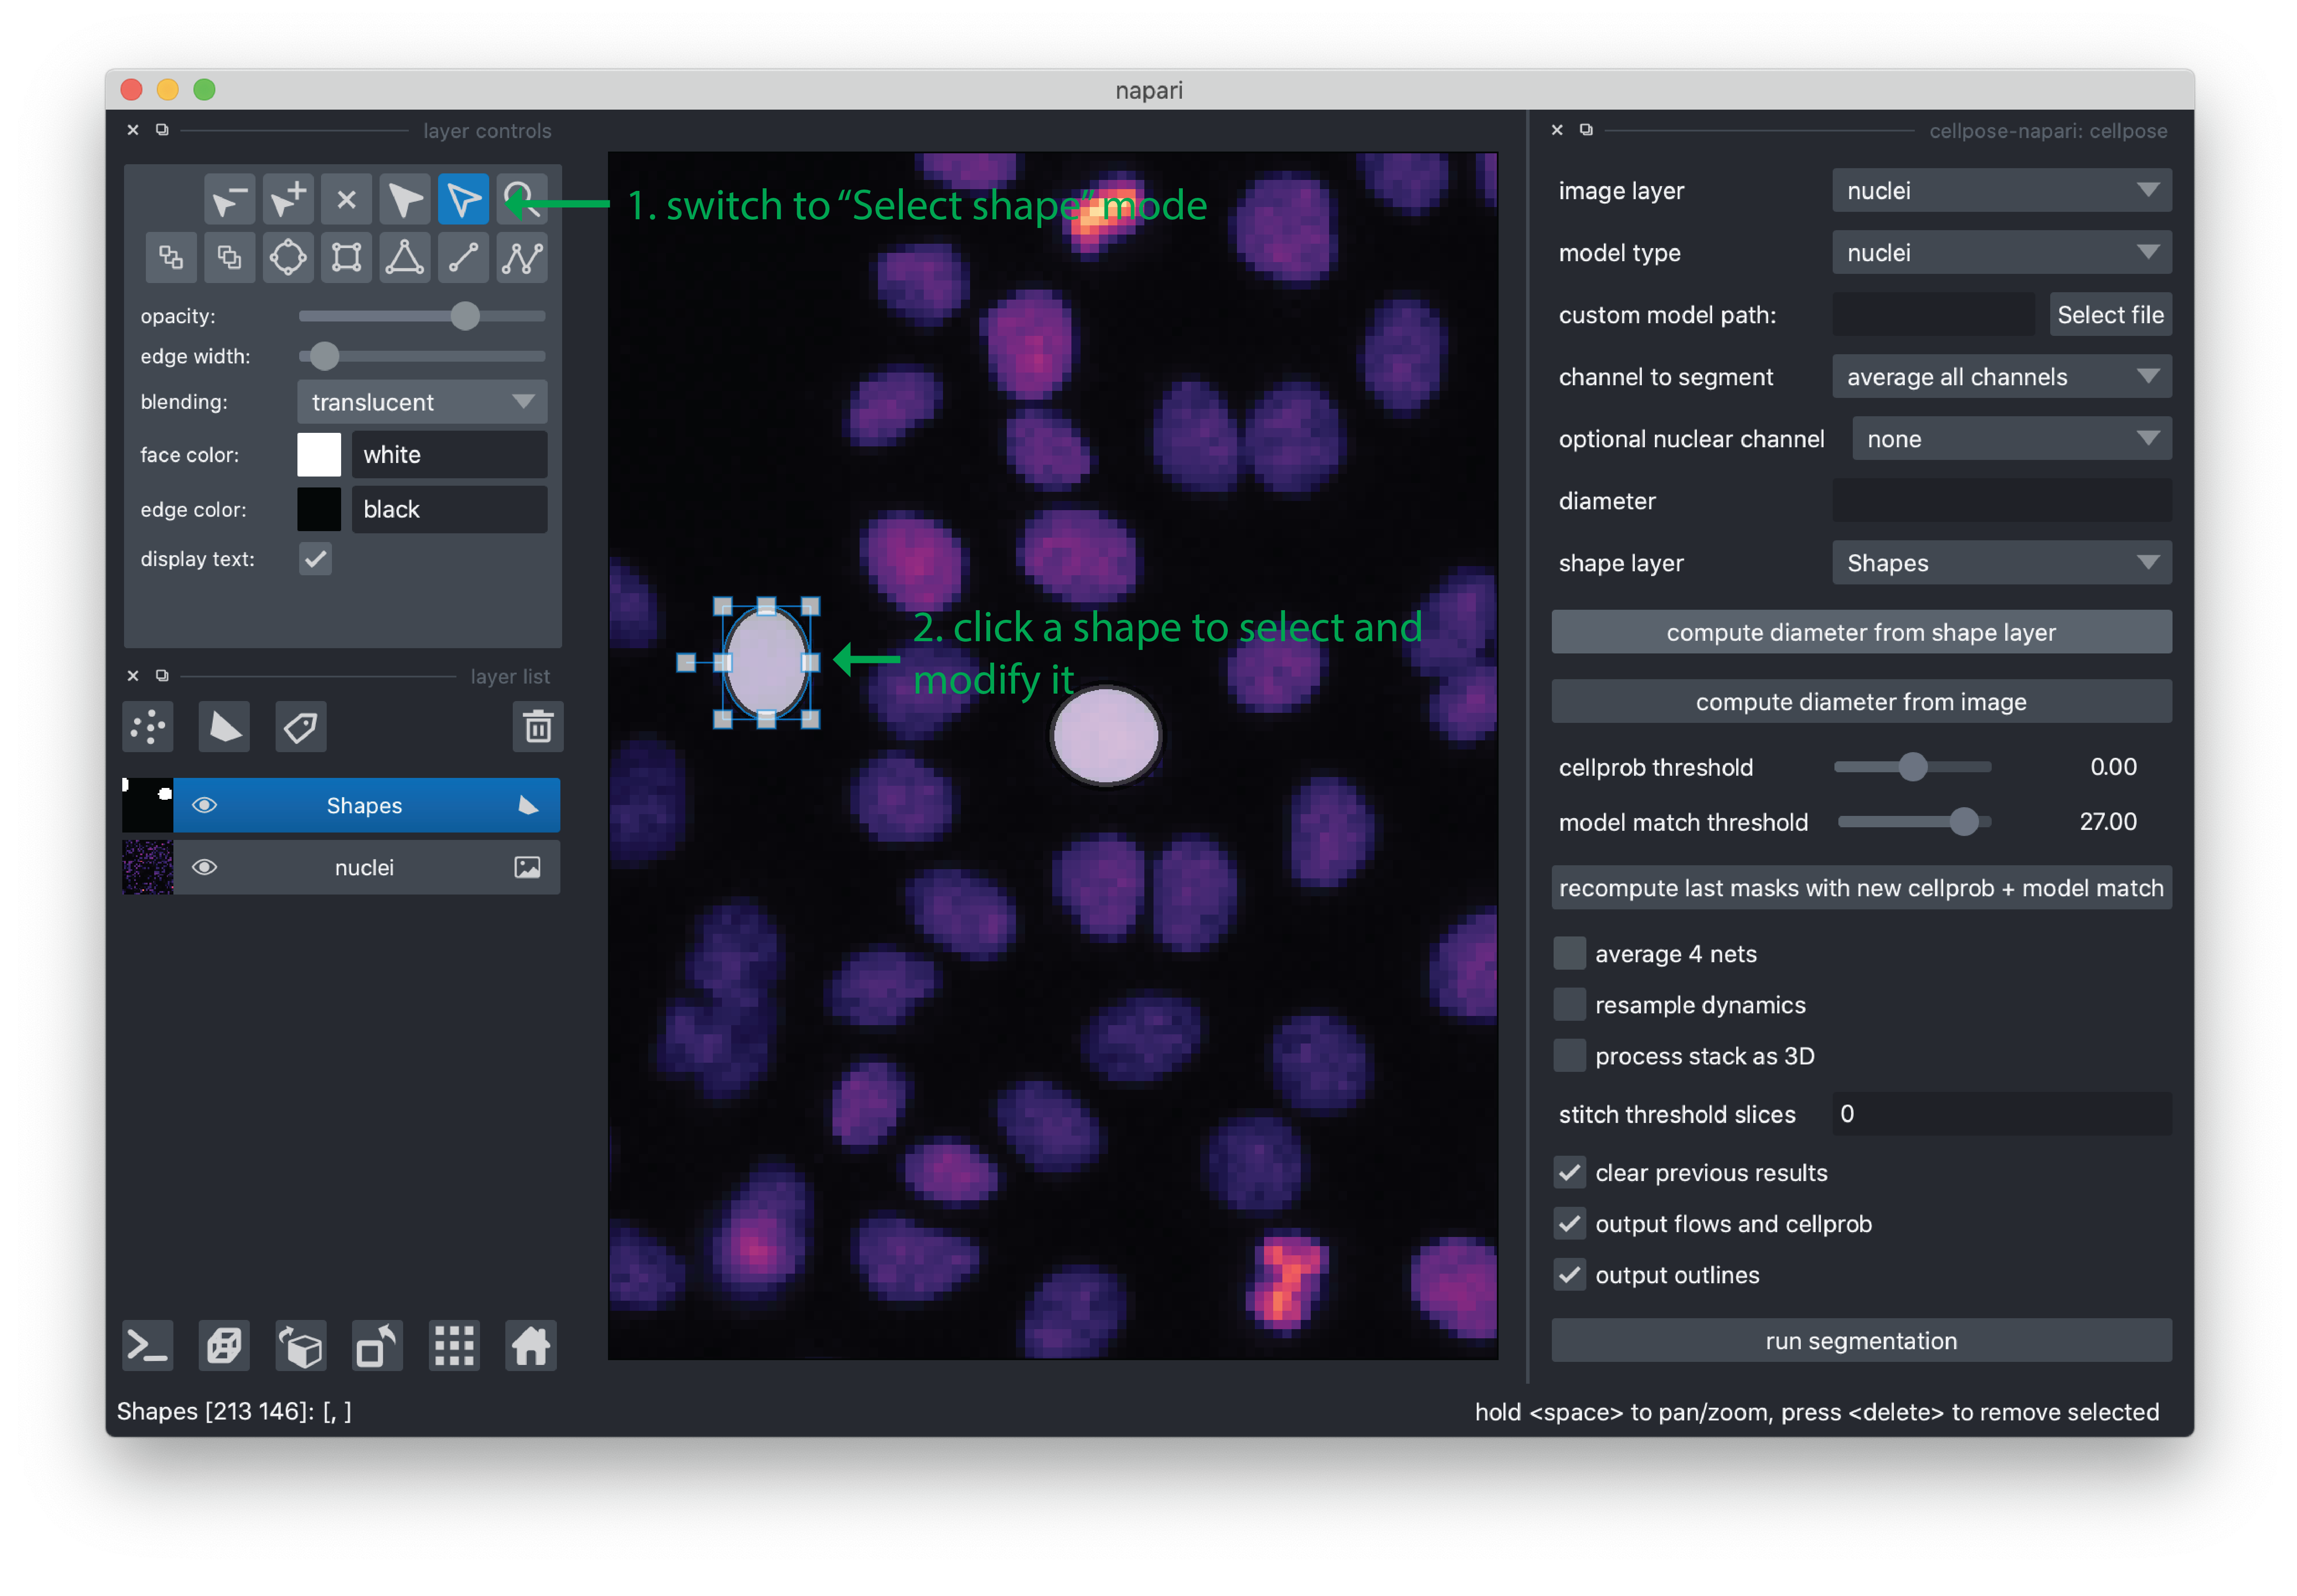
If you would like to edit or move an ellipse, you can switch to “Select shapes” mode in the viewer. Shapes can now be moved by clicking on them and then dragging. They can be resized by selecting them and then dragging the control points.
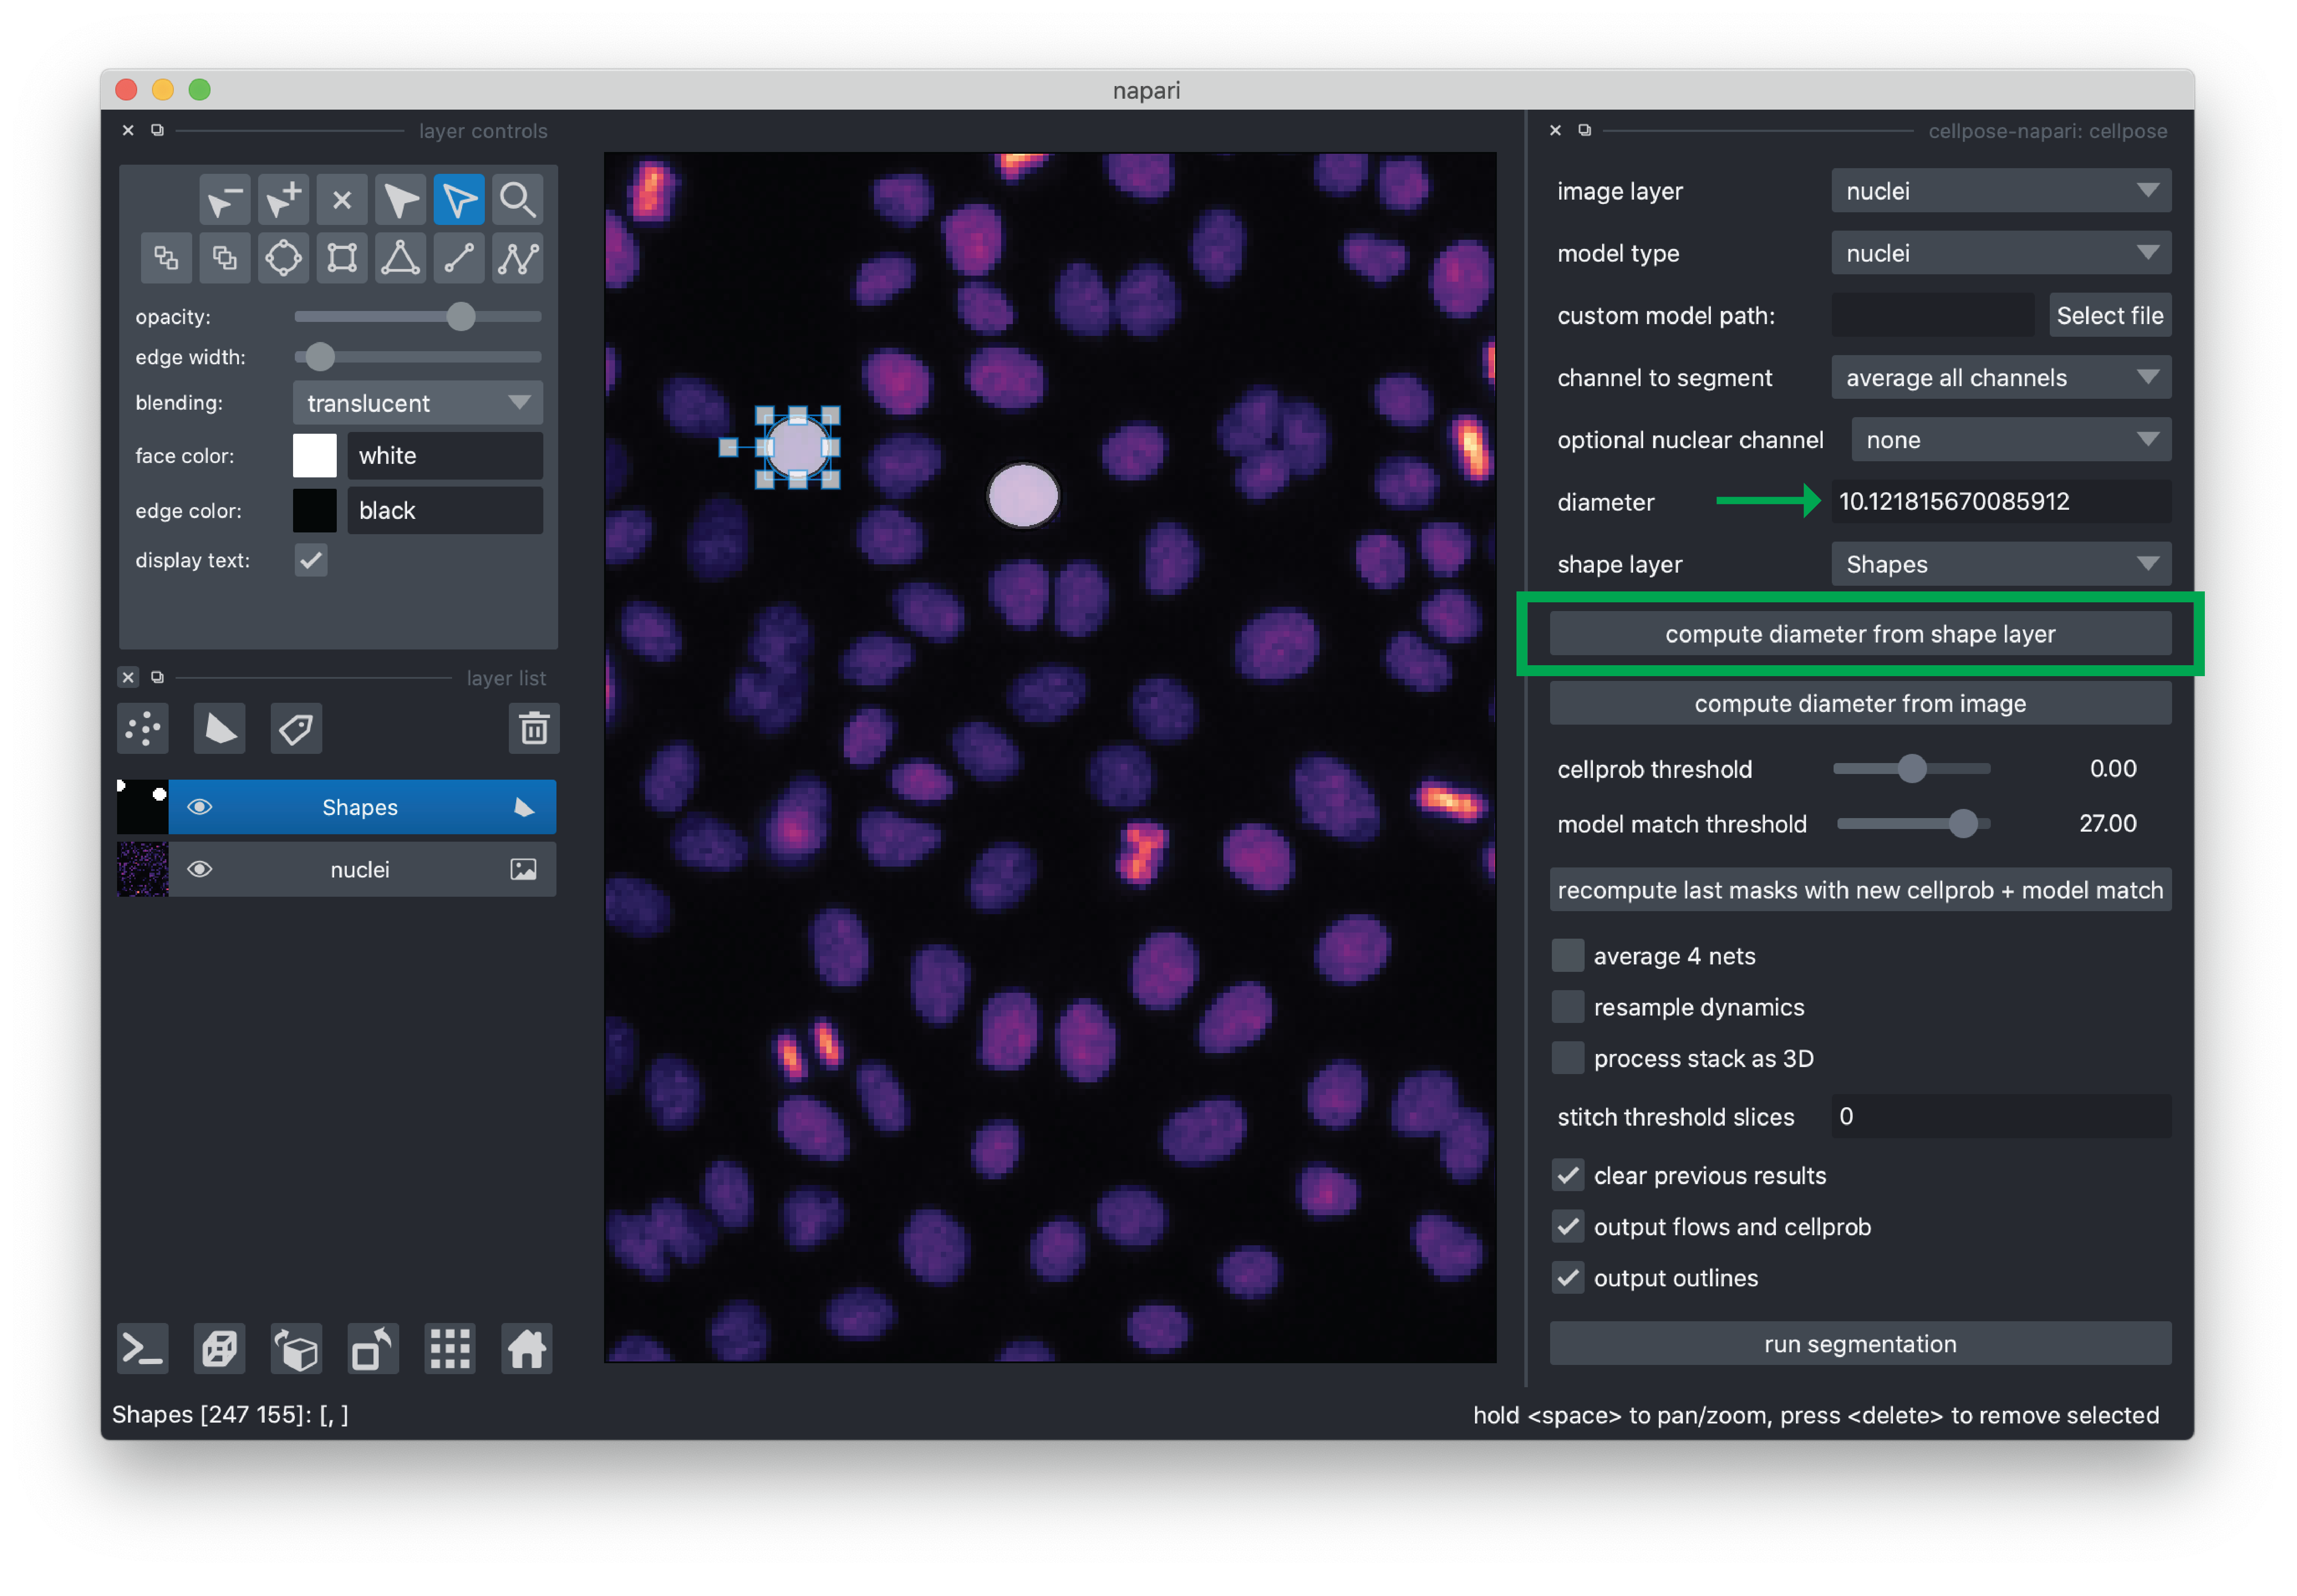
Once you are happy with your annotations, you can click the “compute diameter from shape layer” button and you will see the “diameter” value populated. For this demo, the value is typically around 10 pixels.
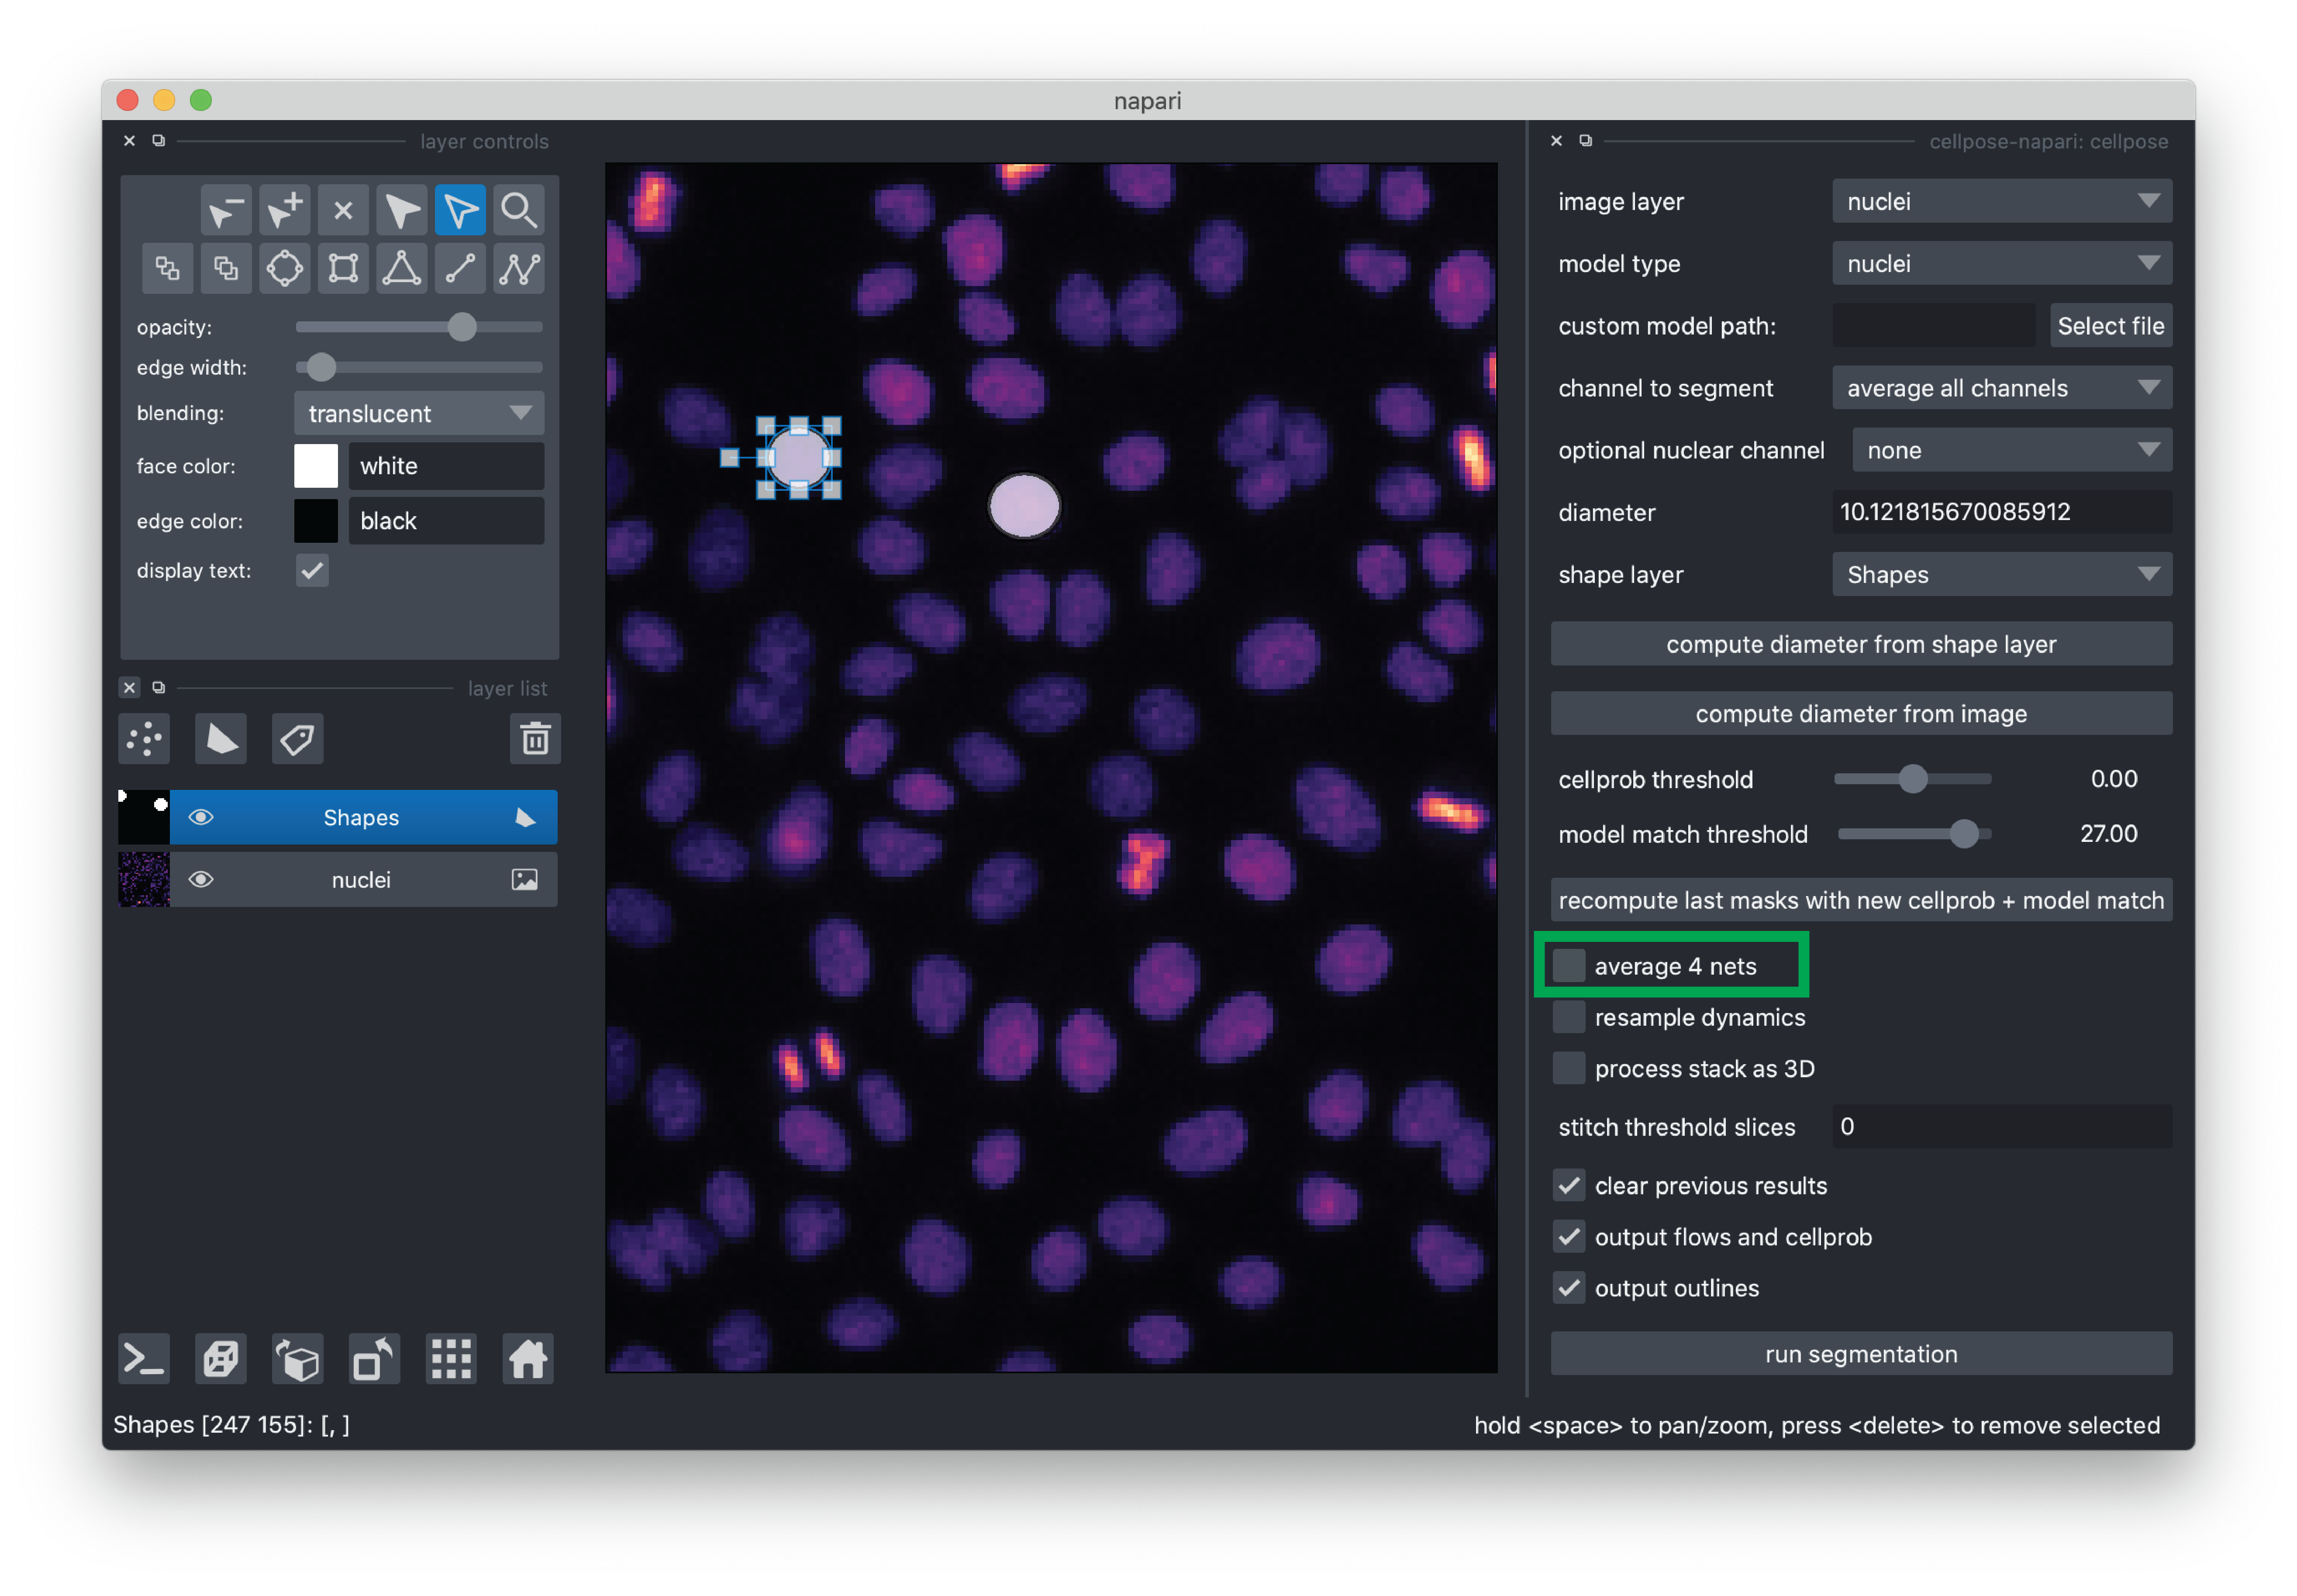
For this demo, we recommend de-selecting “average 4 nets”(potentially less accurate, but faster segmentation) and otherwise using the default settings. If you would like to learn more about the cellpose settings, please see the cellpose plugin documentation.
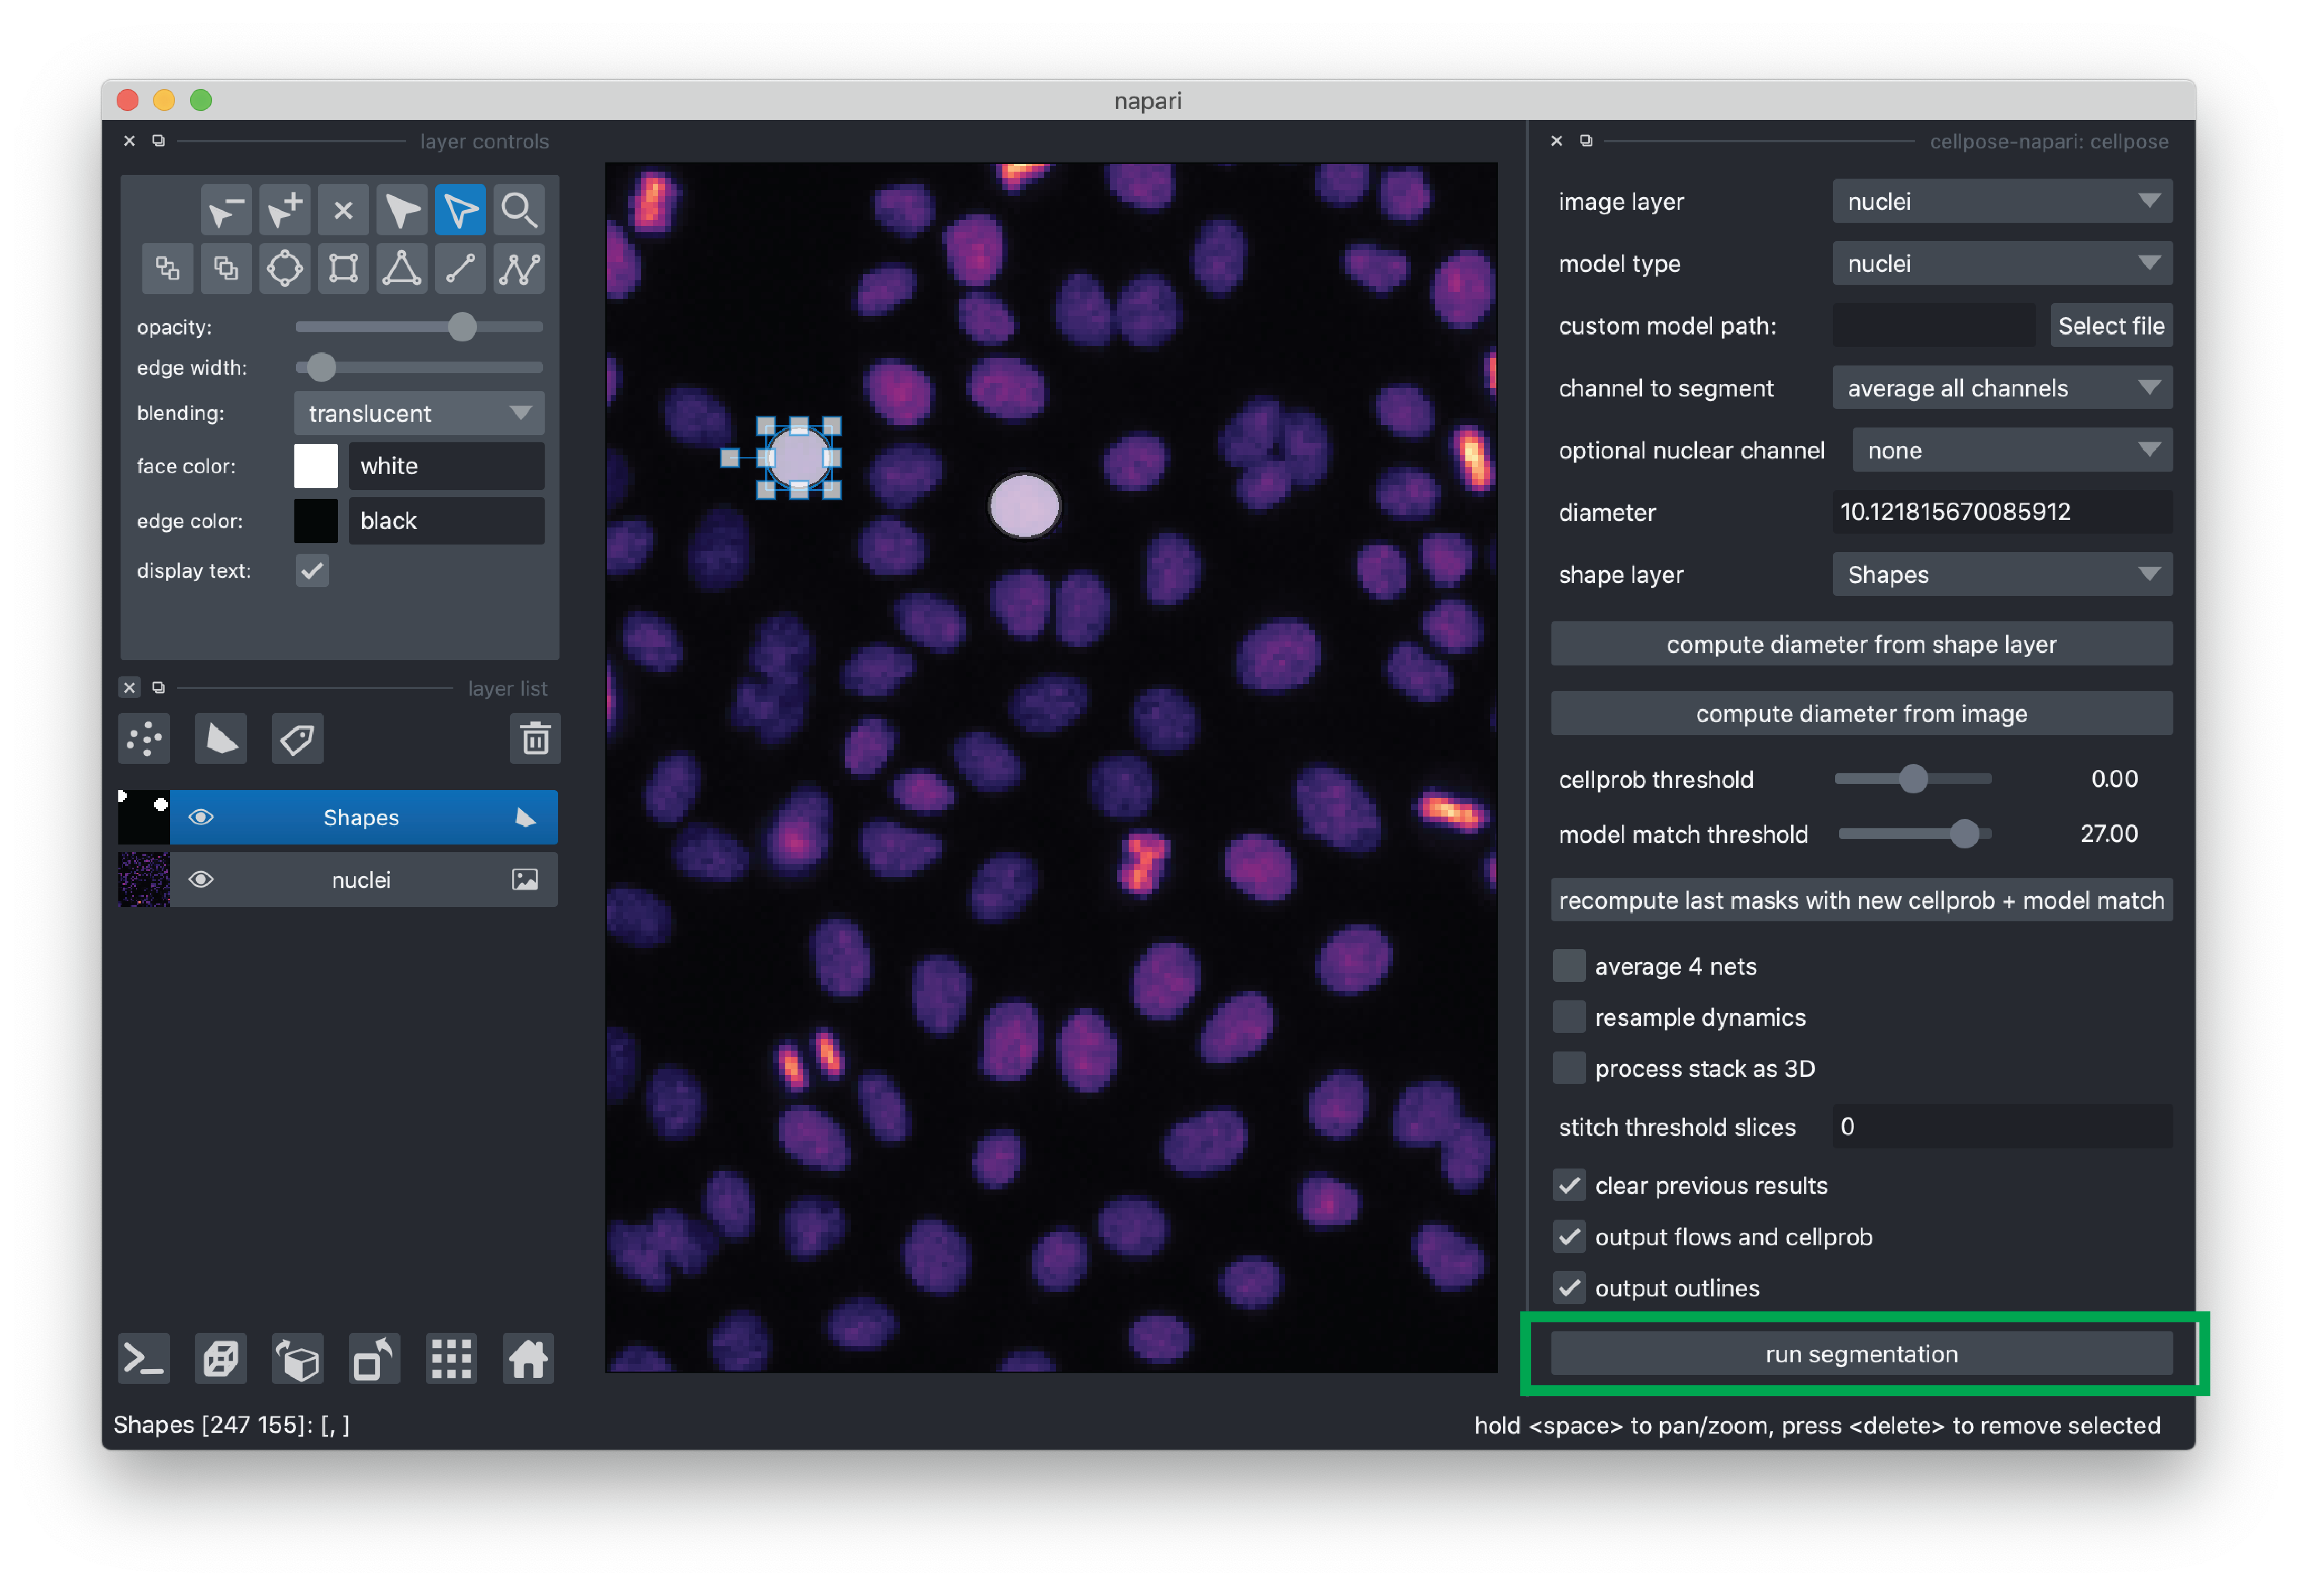
Now you are ready to run the segmentation! Click the “run segmentation” button. Segmentation for this demo typically takes ~1.5 minutes. Note that there is not currently a progress bar, so please just be patient.
When the segmentation is completed, you will see some new layers added to the layer list. Of particular interest is “nuclei_p_masks_000”, which contains our segmentation mask added as a Labels layer.
Quantify nuclei shape#
In this next section, we will compute and display some basic properties of the segmented cells (e.g., area) using scikit-image and matplotlib.
Measure area and perimeter#
cellpose outputs the segmentation masks as a label image in a Labels layer called 'nuclei_cp_masks_000'. In napari, we can access the layer data from the layer object’s data property. As we did in the previous exercise, we can access the the layer object from the layer list by its name (viewer.layers['nuclei_cp_masks_000']). From that layer object, we can access the data.
We can use the scikit-image regionprops_table function to measure the area and perimeter of the detected nuclei. regionprops_table outputs a dictionary where each key is a name of a measurement (e.g., 'area') and the value is the measurement value for each detected object (nucleus in the case).
from skimage.measure import regionprops_table

# measure the area and nucleus for each nucleus
label_layer = viewer.layers['nuclei_cp_masks_000']
rp_table = regionprops_table(
    label_layer.data,
    properties=('area', 'perimeter')
)
from matplotlib import pyplot as plt
import numpy as np
# print the median area
median_area = np.median(rp_table['area'])
print(f'median area: {median_area} px')
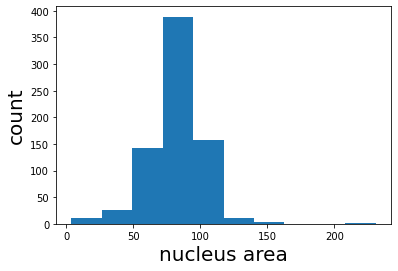
# plot a histogram of the areas
plt.hist(rp_table['area']);
plt.xlabel('nucleus area', fontsize=20);
plt.ylabel('count', fontsize=20);
plt.show();
median area: 83.0 px
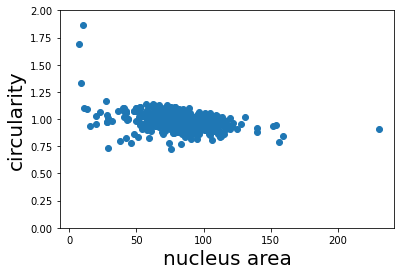
Finally, we can calculate the circularity from the area and perimeter measurements we made above. The circularity is a shape factor that is 1 when the object is a circle and less than one for shapes that are more “starfish-like”/ The circularity is defined as
where A is the area and P is the perimeter of the object. We plot the circularity vs. the area and see that the circularity of the nuclei does not appear to depend on the area.
# calculate the circularity of the nuclei
circularity = (4 * np.pi * rp_table['area']) / np.square(rp_table['perimeter'])

# use matplot lib to visualize the relationship between nucleus circularity and area
plt.scatter(rp_table['area'], circularity);
plt.xlabel('nucleus area', fontsize=20);
plt.ylabel('circularity', fontsize=20);
plt.ylim((0, 2))
plt.show()
Conclusions#
In this notebook, we have used the cellpose-napari plugin to perform nucleus segmentation. We then used the results of the segmentation to inspect the relationship between nucleus area and circularity. This demonstration highlights how one can combine napari plugins and python libraries to make measurements on microscopy data.